When running Google Ads campaigns, you know that staying ahead of the competition is everything. But keeping track of who’s winning in your space, and how, can be a tedious and manual task.
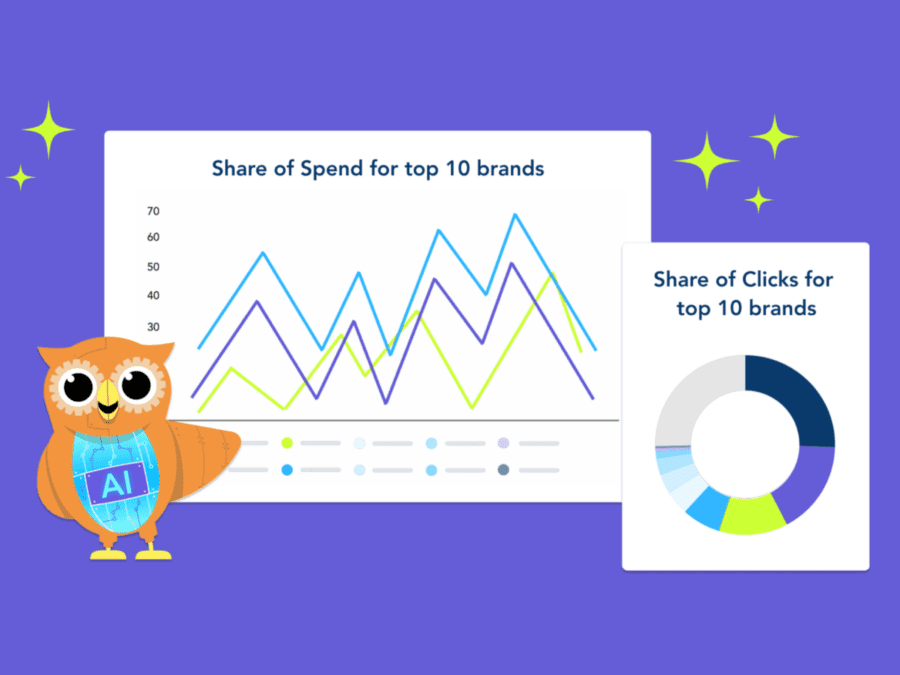
Adthena’s PPC Market Share Analysis reports provide you with an instant view of performance insights across hundreds of sub-industries. Not only that, with our GenAI Analyst, Ask Arlo providing commentary on key findings, analyzing search data has never been easier. These reports are automatically updated every single month, giving you a clear, data-backed summary of who’s leading the market and where the biggest opportunities are.
Leveraging Adthena’s Whole Market View™ technology, these reports provide a snapshot of search performance within your sub-industry.
What’s inside the PPC Market Share reports?
Think of these reports as a cheat sheet for your industry’s search landscape. Here’s a breakdown of each report and how they can benefit your strategy:
1. Share of Clicks
What it shows:
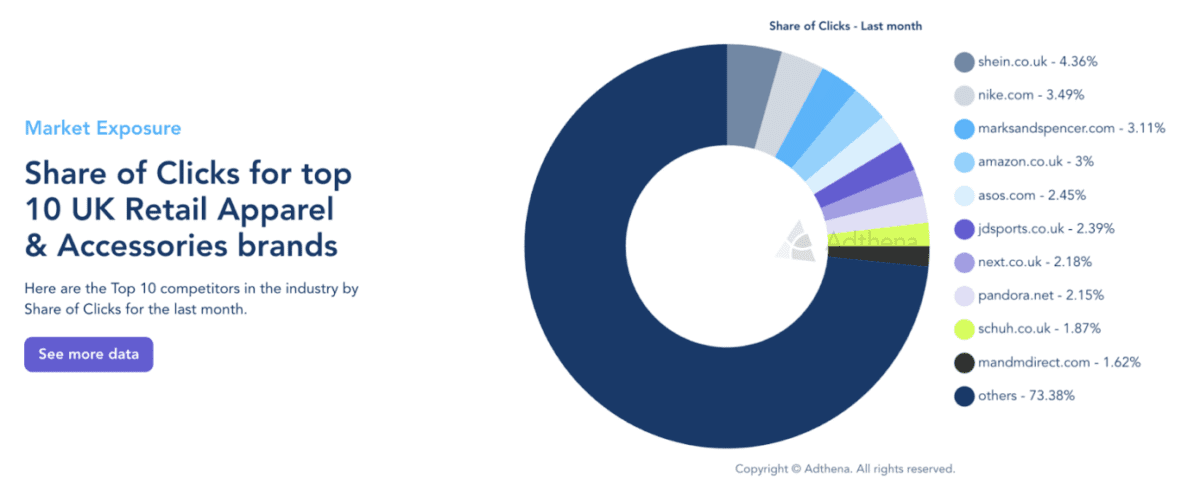
The Share of Clicks report shows the percentage of total clicks for the top 10 brands within your sub-industry from the previous month. In the UK Retail Apparel & Accessories report below, we can see brands like Shein.co.uk and Nike are leading the charge and dominating the diverse competition.
Why it’s useful:
By using the Share of Clicks report, you’ll instantly see which competitors are capturing the most clicks, so you can benchmark your performance, identify opportunities to outbid or out-message them, and reclaim lost market share.
How to use it:
- Identify leaders: Recognize the brands in your industry that are capturing the most traffic.
- Track trends: Monitor which competitors are gaining momentum and which are losing ground.
- Adjust strategy: Refine your approach to capture more of the traffic that’s currently going to others.
2. Share of Spend
What it shows:
The Share of Spend report tracks how much of the total ad budget your top 10 competitors were spending last month. In the US Services Legal Brands report, forthepeople.com led the charge, peaking at 6.95% and ending at 4.37%, while sweetjames.com saw an uptick, closing at 3.51%. If your competitors are increasing their budgets during certain periods, you can adjust your strategy to stay competitive.
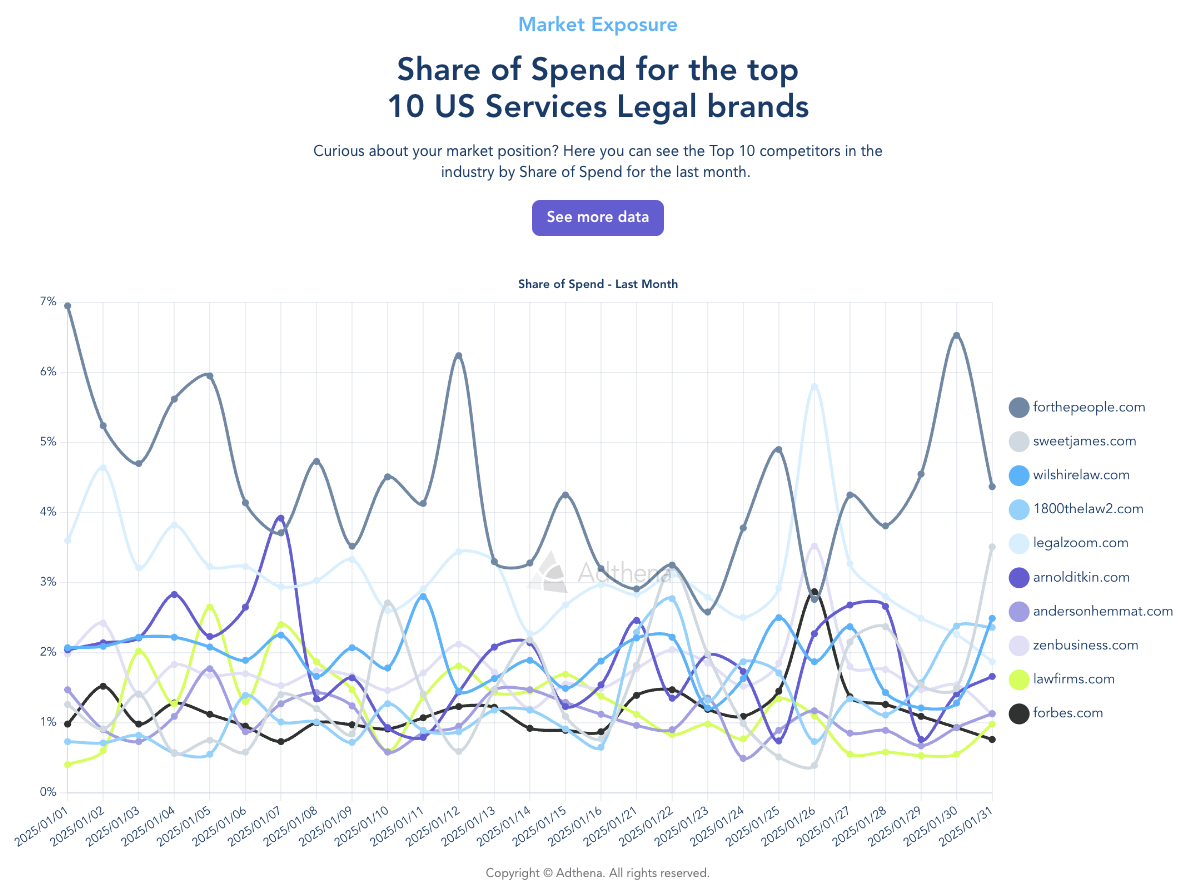
Why it’s useful:
Knowing where your competitors are putting their money allows you to assess if they’re investing heavily in certain campaigns or product categories. This could indicate market trends or areas where they’re trying to gain an edge.
How to use it:
- Evaluate competitive intensity: Are competitors outspending you in critical areas?
- Refine your budget allocation: If others are spending heavily in a specific category, it might be worth your attention.
- Track spend shifts: If spend is increasing or decreasing in certain areas, it can signal rising competition or emerging opportunities.
3. Market exposure
What it shows:
The Competitor Count report provides an overview of the total number of competitors bidding on ads in your sub-industry last month.
The UK Gambling & Gaming Sports Betting report shows how the number of active competitors fluctuated throughout January 2025. You can see the number of advertisers peak at 246 mid-month and then decline to 177 by the end of the month.
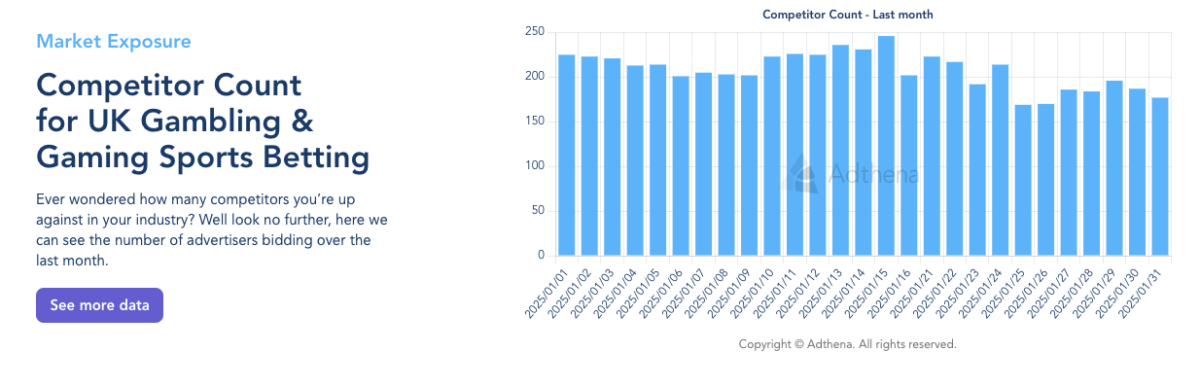
Why it’s useful:
Understanding how crowded your space is gives you a sense of the overall competition level. If there are more advertisers, it might be harder to get the clicks you want, but it also means there’s a large market opportunity.
Google Ads’ Auction Insights only offers a snapshot of top competitors, but Adthena’s data gives you a fuller picture, helping you see if rising CPCs are due to increasing competitor volume, not just top competitor activity. With Performance Max and broad match, advertisers are seeing more overlap on terms due to looser query matching, which can further contribute to the competition and fluctuations in CPCs.
How to use it:
- Understand your competitive environment: If the market is getting more saturated, you might need to be more aggressive with your strategy.
- Assess the opportunity size: A larger number of competitors may mean higher competition but also a bigger audience to target.
- Adjust bids based on market activity: If competition spikes and CPCs rise, you may need to adjust bids strategically, either increasing spend to maintain visibility or shifting budget to less competitive terms.
-
4. Biggest movers
What it shows:
Within the Market Loss and Market Gains report, you’ll see who’s making the biggest moves in your industry, both in terms of market share gains and losses.
In the US Travel Transportation sector, you can see brands like Kayak.com and Enterprise.com had the most significant changes in their share of the market.
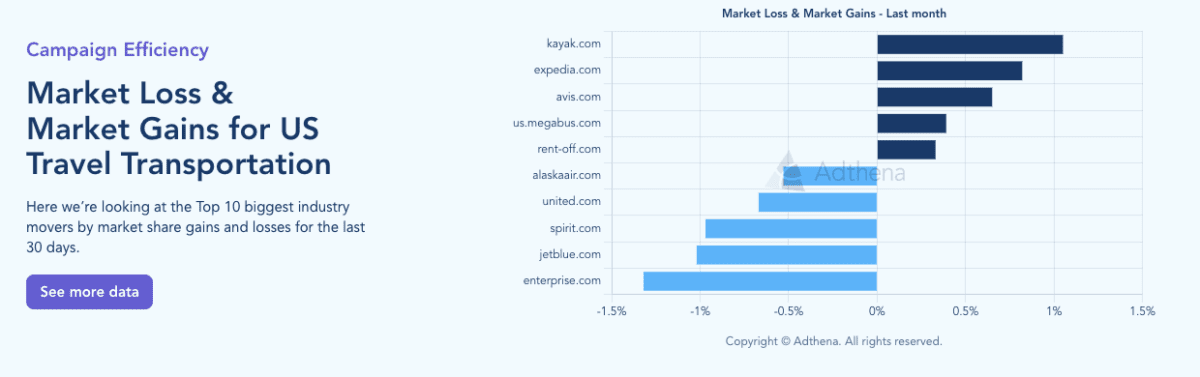
Why it’s useful:
Tracking the biggest movers gives you a head start on identifying what’s working or not. If a competitor is seeing a huge uptick in market share, it might be a good idea to investigate what they’re doing right and whether you can implement some of those tactics. Alternatively, if a competitor is dropping off, you might want to capitalize on their lost momentum.
How to use it:
- Watch for shifts in your industry: Stay ahead by adapting your approach based on major competitor movements.
- Study surging competitors: Analyze what top movers are doing differently to drive their success.
- Capitalize on competitor declines: Identify struggling competitors and look for ways to capture their lost share.
5. Share of Impressions
What it shows:
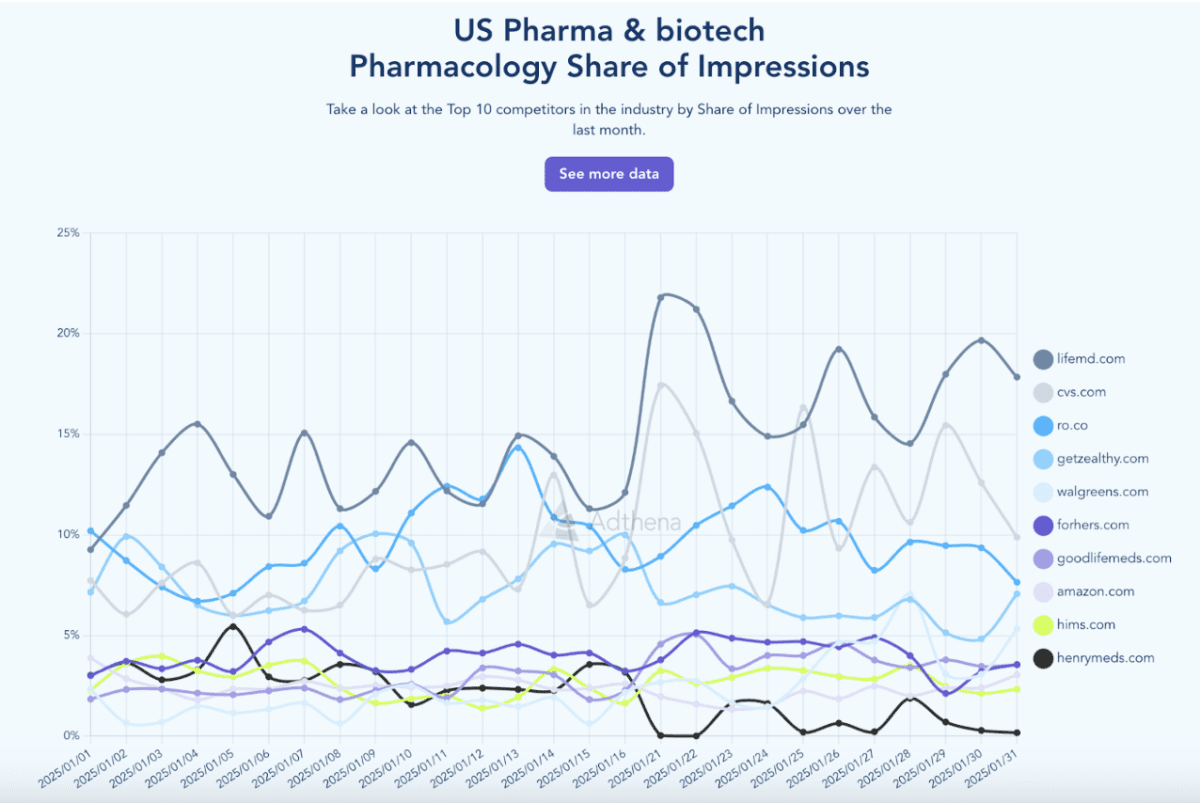
The Share of Impressions report illustrates how often ads were shown compared to all other advertisers bidding last month.
In the US Pharma & Biotech Pharmacology report, you see how competitors like LifeMD and CVS dominate visibility for key search terms, with LifeMD peaking at 21.80% on January 21st, 2025.
This data helps you understand how much exposure each competitor is getting, not just in the auctions you’re part of, but across all potential impressions for the search terms in your category.
Why it’s useful:
Google Ads’ impression share only accounts for auctions you were eligible to show in, meaning it can be influenced by factors like your bids, budgets, and broad match keywords. It only reflects impressions when your ad was actually shown, leaving out important opportunities where you weren’t in the auction.
On the other hand, Adthena’s Share of Impressions takes a more comprehensive approach by showing all impressions a search term could have received, even when no paid ad was shown. This gives you a clearer, more objective view of the total market size and opportunity, helping you assess visibility across the entire competitive landscape.
Learn more about the limitations of auction insights here.
How to use it:
- Compare visibility: See where your competitors are capturing more impressions and adjust your strategy.
- Track trends: Spot fluctuations in impression share to identify market shifts.
- Optimize strategy: Adjust bids and budget to target high-value impressions competitors may be missing.
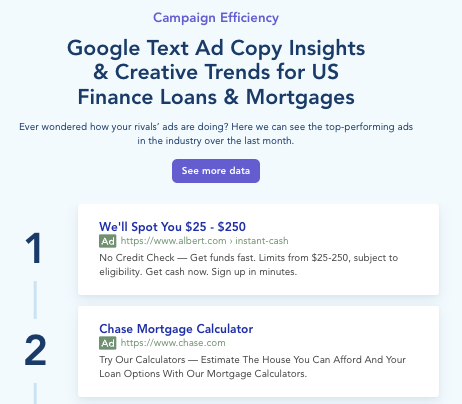
6. Google text Ad Copy Insights and creative trends
What it shows:
The Google Text Ad Copy Insights & Creative Trends report breaks down the most effective ad copy strategies by showing you the five top-performing ads in your sub-industry. It includes copy themes such as discounts, product features, and calls to action. You can also see which ads are served the most.
Why it’s useful:
Understanding what types of ad copy are getting the most visibility with your target audience is incredibly valuable. By knowing the themes that are being served the most, you can optimize your own ads to align with those that are getting the highest impressions and frequency. This can also provide inspiration for A/B testing and refining your messaging.
How to use it:
- Get inspired by top ads: See which words, phrases, and offers your competitors are using successfully.
- Refine your messaging: Use insights from top-performing ads to craft more compelling copy for your brand.
- Stay competitive: Avoid using the same language as your competitors to stand out in the crowded PPC landscape.
Powering confident decisions with Adthena data
Adthena uses a blend of machine learning, natural-language-processing, and GenAI to provide unique insights into the paid search landscape.
Our patented, machine-learned technology, Whole Market View™, finds the relevant search terms for a customer’s unique domain, and automatically monitors them daily to uncover new opportunities in the customer’s market.
Our PPC Market Share Analysis reports leverage Whole Market View data, to explore recent trends in Google Ads. With the help of our GenAI-data analyst, Ask Arlo, data is then analyzed to provide key insights to help you measure your paid search success.
Learn more about how Adthena collects, analyzes and interprets data.
Stay ahead with comprehensive PPC insights
With Adthena’s PPC Market Share Reports and the power of our industry-leading data, you can stay on top of the competition, spot new opportunities, and optimize your PPC campaigns with confidence.
These insights, updated monthly, give you a comprehensive view of your industry’s competitive landscape, helping you make smarter, data-driven decisions that drive success. For even more granular data, Adthena’s subscription offers daily updates and a full competitive landscape, empowering you to refine your strategy and stay ahead at all times.
Want to see how your brand stacks up? Explore the PPC Market Share Analysis Reports.